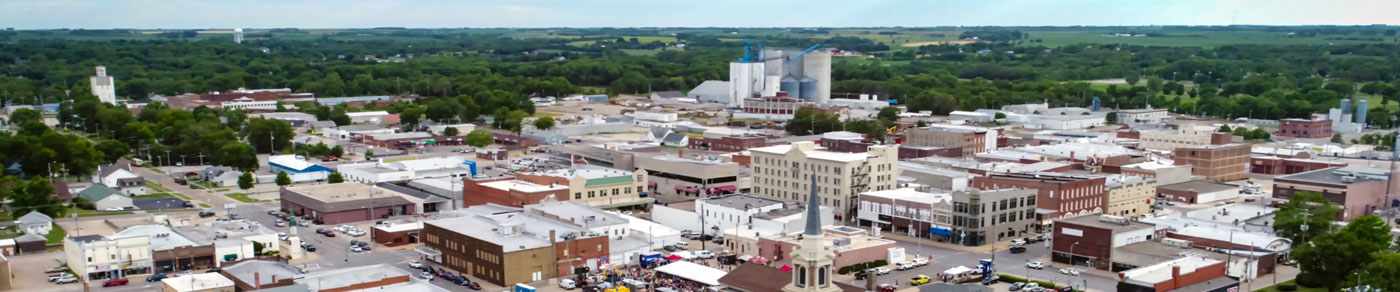


Seward
Population
Back To Top
Back To Top
Population
| Population | 2000 | 2010 | 2023 | 2028 |
|---|---|---|---|---|
| Seward | 6,529 | 7,026 | 7,775 | 7,867 |
Source: ESRI, 2023-10-17
Population by Age
| Population | 2023 |
|---|---|
| 0-4 | 429 |
| 5-9 | 450 |
| 10-14 | 471 |
| 15-19 | 826 |
| 20-24 | 656 |
| 25-29 | 413 |
| 30-34 | 473 |
| 35-39 | 501 |
| 40-44 | 401 |
| 45-49 | 371 |
| 50-54 | 382 |
| 55-59 | 458 |
| 60-64 | 437 |
| 65-69 | 424 |
| 70-74 | 339 |
| 75-79 | 290 |
| 80-84 | 214 |
| 85+ | 240 |
| 18+ | 6,125 |
| Median Age | 37 |
Source: ESRI, 2023-10-17
Population by Race
| Seward | 2023 |
|---|---|
| Total | 7,775.00 |
| White Alone | 93.21% |
| Black Alone | 0.91% |
| American Indian Alone | 0.31% |
| Asian Alone | 0.44% |
| Pacific Islander Alone | 0.04% |
| Some Other Race | 1.07% |
| Two or More Races | 4.03% |
| Hispanic Origin | 3.92% |
| Diversity Index | 19.50 |
Source: ESRI, 2023-10-17
Growth Rate
| Seward | 2023 - 2028 |
|---|---|
| Population | 0.24% |
| Households | 0.36% |
| Families | 0.26% |
| Median Household Income | 2% |
| Per Capita Income | 3% |
Source: ESRI, 2023-10-17
Housing
Back To Top
Households
| Population | 2000 | 2010 | 2023 | 2028 |
|---|---|---|---|---|
| Households | 2,346 | 2,542 | 2,893 | 2,946 |
| Housing Units | 2,469 | 2,799 | 3,084 | 3,120 |
| Owner Occupied Units | 1,954 | 2,017 | ||
| Renter Occupied Units | 939 | 929 | ||
| Vacant Units | 191 | 174 |
Source: ESRI, 2023-10-17
Home Value
| Seward | 2023 | 2028 |
|---|---|---|
| Median Home Value | $187,027 | $235,068 |
| Average Home Value | $216,952 | $267,365 |
| <$50,000 | 33 | 17 |
| $50,000 - $99,999 | 173 | 76 |
| $100,000 - $149,999 | 380 | 210 |
| $150,000 - $199,999 | 528 | 446 |
| $200,000 - $249,999 | 310 | 370 |
| $250,000 - $299,999 | 232 | 378 |
| $300,000 - $399,999 | 147 | 258 |
| $400,000 - $499,999 | 73 | 108 |
| $500,000 - $749,999 | 65 | 131 |
| $1,000,000 + | 1 | 2 |
Source: ESRI, 2023-10-17
Housing Year Built
| Year Range | Houses Built |
|---|---|
| 2010 or Later | 165 |
| 2000-2009 | 377 |
| 1990-1999 | 398 |
| 1980-1989 | 272 |
| 1970-1979 | 479 |
| 1960-1969 | 306 |
| 1950-1959 | 210 |
| 1940-1949 | 163 |
| 1939 or Before | 415 |
Source: ESRI, 2023-10-17
Back To TopIncome
Back To Top
Income
| Seward | 2023 | 2028 |
|---|---|---|
| Median Household | $81,715 | $89,902 |
| Average Household | $98,010 | $110,307 |
| Per Capita | $36,497 | $41,335 |
Source: ESRI, 2023-10-17
Household Income
| Seward | 2023 |
|---|---|
| <$15,000 | 189 |
| $15,000 - $24,999 | 181 |
| $25,000 - $34,999 | 246 |
| $35,000 - $49,999 | 272 |
| $50,000 - $74,999 | 425 |
| $75,000 - $99,999 | 405 |
| $100,000 - $149,999 | 772 |
| $150,000 - $199,999 | 249 |
| $200,000+ | 154 |
Source: ESRI, 2023-10-17
Back To TopEmployees
Back To Top
Commute
| Category | Commuters |
|---|---|
| Workers 16+ | 3,859 |
| In-County Residents | 2,716 |
| Out-of-County Residents | 1,128 |
| Drive Alone | 2,908 |
| Carpooled | 391 |
| Public Transport | 0 |
| Work at Home | 168 |
| Motorcycle | 0 |
| Bicycle | 89 |
| Walked | 294 |
| Other | 8 |
| Less than 5 minutes | 527 |
| 5-9 minutes | 1,178 |
| 10-14 minutes | 445 |
| 15-19 minutes | 126 |
| 20-24 minutes | 302 |
| 25-29 minutes | 239 |
| 30-34 minutes | 340 |
| 35-39 minutes | 182 |
| 40-44 minutes | 148 |
| 45-59 minutes | 133 |
| 60-89 minutes | 27 |
| 90+ minutes | 45 |
| Average Travel Time | 0 |
Source: ESRI, 2023-10-17
Source: ESRI, 2023-10-17
Employees by NAICS
| Category | Number |
|---|---|
| Total Employees | 3,167 |
| Agr/Forestry/Fish/Hunt | 0 |
| Mining | 0 |
| Utilities | 24 |
| Construction | 91 |
| Manufacturing | 382 |
| Wholesale Trade | 75 |
| Retail Trade | 274 |
| Motor Veh/Parts Dealers | 40 |
| Furn & Home Furnish Str | 0 |
| Electronics & Appl Store | 29 |
| Bldg Matl/Garden Equip | 31 |
| Food & Beverage Stores | 67 |
| Health/Pers Care Stores | 27 |
| Gasoline Stations | 29 |
| Clothing/Accessory Store | 2 |
| Sports/Hobby/Book/Music | 36 |
| General Merchandise Str | 13 |
| Transportation/Warehouse | 56 |
| Information | 52 |
| Finance & Insurance | 127 |
| Cntrl Bank/Crdt Intrmdtn | 75 |
| Sec/Cmdty Cntrct/Oth Inv | 18 |
| Insur/Funds/Trusts/Other | 34 |
| Real Estate/Rent/Leasing | 50 |
| Prof/Scientific/Tech Srv | 118 |
| Legal Services | 59 |
| Mgmt of Comp/Enterprises | 0 |
| Admin/Support/Waste Mgmt | 18 |
| Educational Services | 255 |
| HealthCare/Social Assist | 783 |
| Arts/Entertainment/Rec | 48 |
| Accommodation/Food Srvcs | 317 |
| Accommodation | 21 |
| Food Srv/Drinking Places | 296 |
| Other Srv excl Pub Admin | 244 |
| Auto Repair/Maintenance | 30 |
| Public Administration Emp | 241 |
Source: ESRI, 2023-10-17
Educational Attainment (25+)
| Seward | 2023 |
|---|---|
| <9th Grade | 77 |
| Some High School | 148 |
| GED | 113 |
| Graduated High School | 1,126 |
| Some College/No Degree | 880 |
| Associates Degree | 705 |
| Bachelor's Degree | 1,211 |
| Graduate Degree | 683 |
Source: ESRI, 2023-10-17
Back To TopBusinesses
Back To Top
Businesses by NAICS
| Category | Number |
|---|---|
| Total Businesses | 379 |
| Agr/Forestry/Fish/Hunt Bus | 0 |
| Mining Bus | 0 |
| Utilities Bus | 2 |
| Construction Bus | 23 |
| Manufacturing Bus | 13 |
| Wholesale Trade Bus | 11 |
| Retail Trade Bus | 46 |
| Motor Veh/Parts Dealers Bus | 7 |
| Furn & Home Furnish Str Bus | 0 |
| Electronics & Appl Store Bus | 4 |
| Bldg Matl/Garden Equip Bus | 5 |
| Food & Beverage Stores Bus | 5 |
| Health/Pers Care Stores Bus | 5 |
| Gasoline Stations Bus | 2 |
| Clothing/Accessory Store Bus | 1 |
| Sports/Hobby/Book/Music Bus | 12 |
| General Merchandise Str Bus | 5 |
| Transportation/Warehouse Bus | 10 |
| Information Bus | 10 |
| Finance & Insurance Bus | 23 |
| Cntrl Bank/Crdt Intrmdtn Bus | 5 |
| Sec/Cmdty Cntrct/Oth Inv Bus | 8 |
| Insur/Funds/Trusts/Other Bus | 10 |
| Real Estate/Rent/Leasing Bus | 17 |
| Prof/Scientific/Tech Srv Bus | 19 |
| Legal Services Bus | 5 |
| Mgmt of Comp/Enterprises Bus | 0 |
| Admin/Support/Waste Mgmt Bus | 3 |
| Educational Services Bus | 15 |
| HealthCare/Social Assist Bus | 37 |
| Arts/Entertainment/Rec Bus | 11 |
| Accommodation/Food Srvcs Bus | 26 |
| Accommodation Bus | 5 |
| Food Srv/Drinking Places Bus | 21 |
| Other Srv excl Pub Admin Bus | 58 |
| Auto Repair/Maintenance Bus | 9 |
| Public Administration Bus | 40 |
Source: ESRI, 2023-10-17
Back To Top